Climate Villains · Public data product
Making emissions easier to compare.
I built a climate league table with rankings, everyday comparisons and a clear trail back to the data.
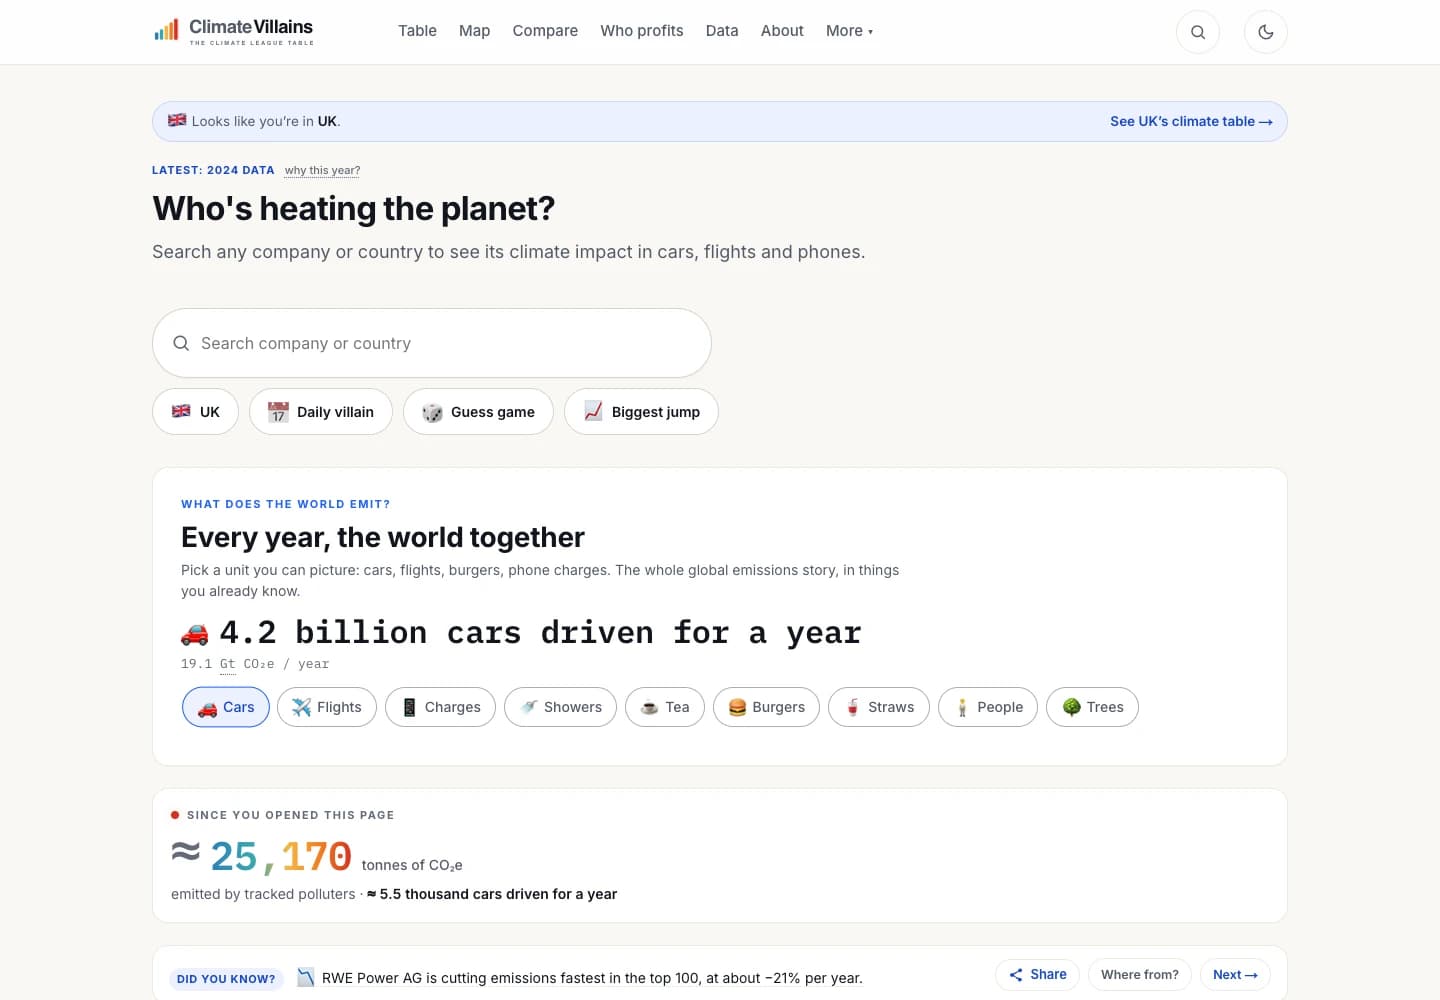
June 2026 snapshot. See the site for attribution coverage and data limitations.
The problem
Emissions figures are hard to compare, and a large number means little without context or a route back to its source.
What I built
I built a repeatable data pipeline and kept confidence information alongside the emissions figures. Readers can search, compare rankings, explore maps and switch to more familiar units.
The result
A public product where readers can explore the numbers, download tables and inspect the assumptions behind them.