Childhood, Inc. · Interactive data storytelling
The business of childhood.
I mapped the revenue and rights behind familiar franchises, with comparisons, a daily guessing game and sources for the figures.
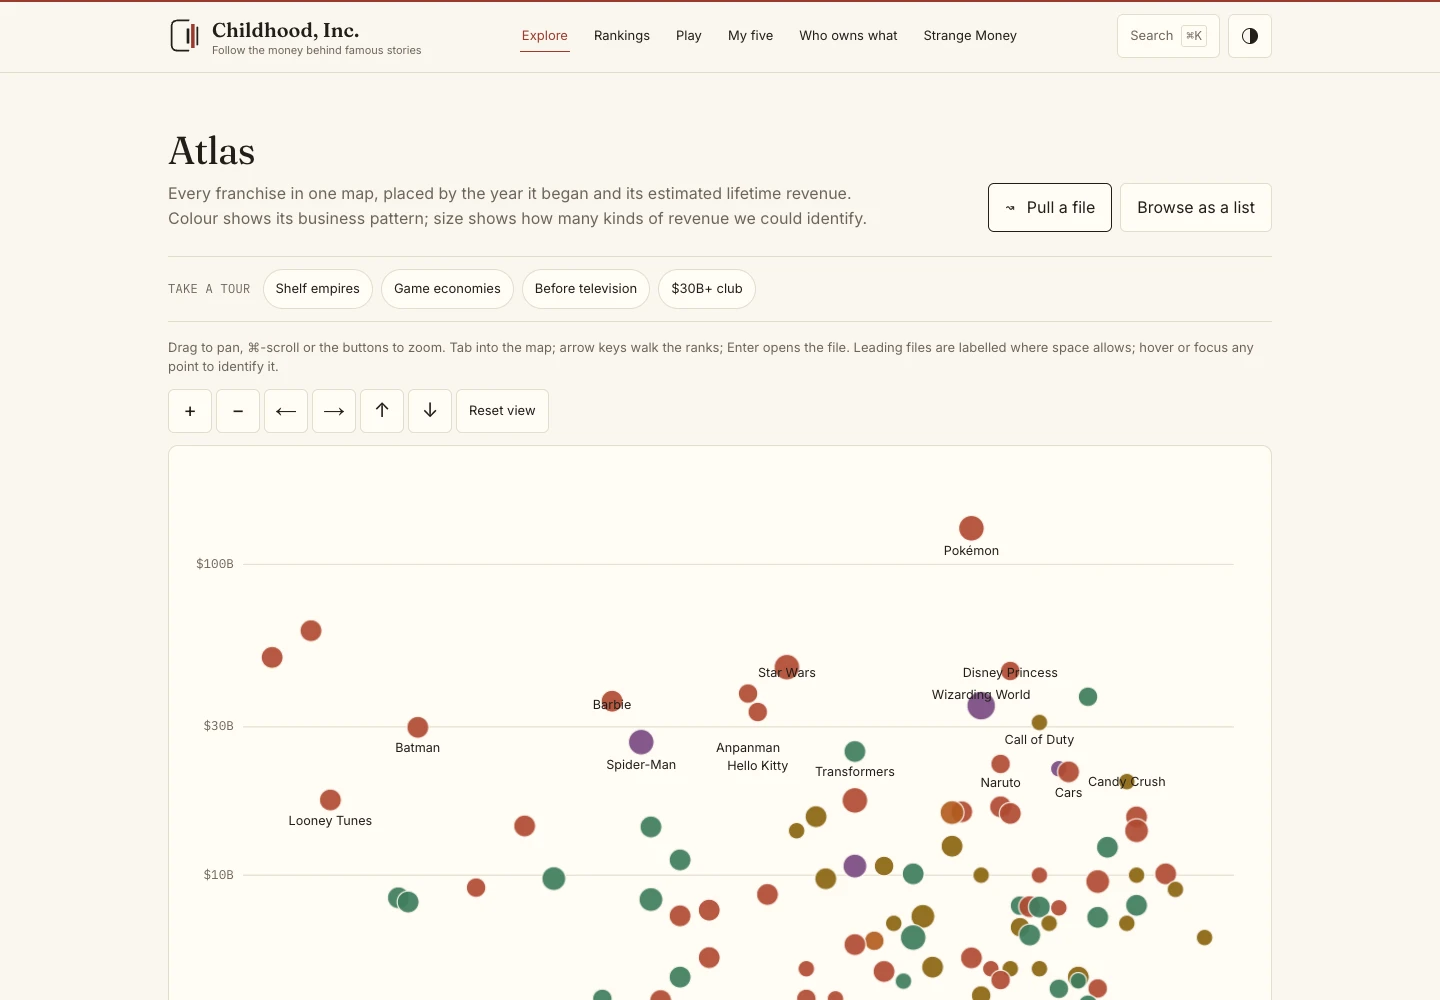
September 2026 snapshot. Revenue estimates include sources, dates and confidence.
The problem
Revenue estimates, ownership claims and reporting periods rarely line up cleanly. A striking chart still needs to show what its numbers mean.
What I built
I put source records into a consistent format, kept their dates and confidence levels, and tracked rights separately from revenue. Readers can explore the data through an atlas, comparisons and a game.
The result
An independent public data experience with 99 franchise files, source details and interactions that make the dataset worth exploring.